Configuring Threshold Settings for Measurement Charts
Heliotics CORE lets you configure custom threshold settings on any measurement chart, defining both lower and upper bounds to match your operational requirements. Once configured, these thresholds provide clear visual indicators whenever readings move outside your specified range—perfect for early warning alerts, quality assurance checks, or keeping critical parameters within target zones. Use this feature for various types of data that evolve over time, such as temperature, electricity consumption or dust particle levels.
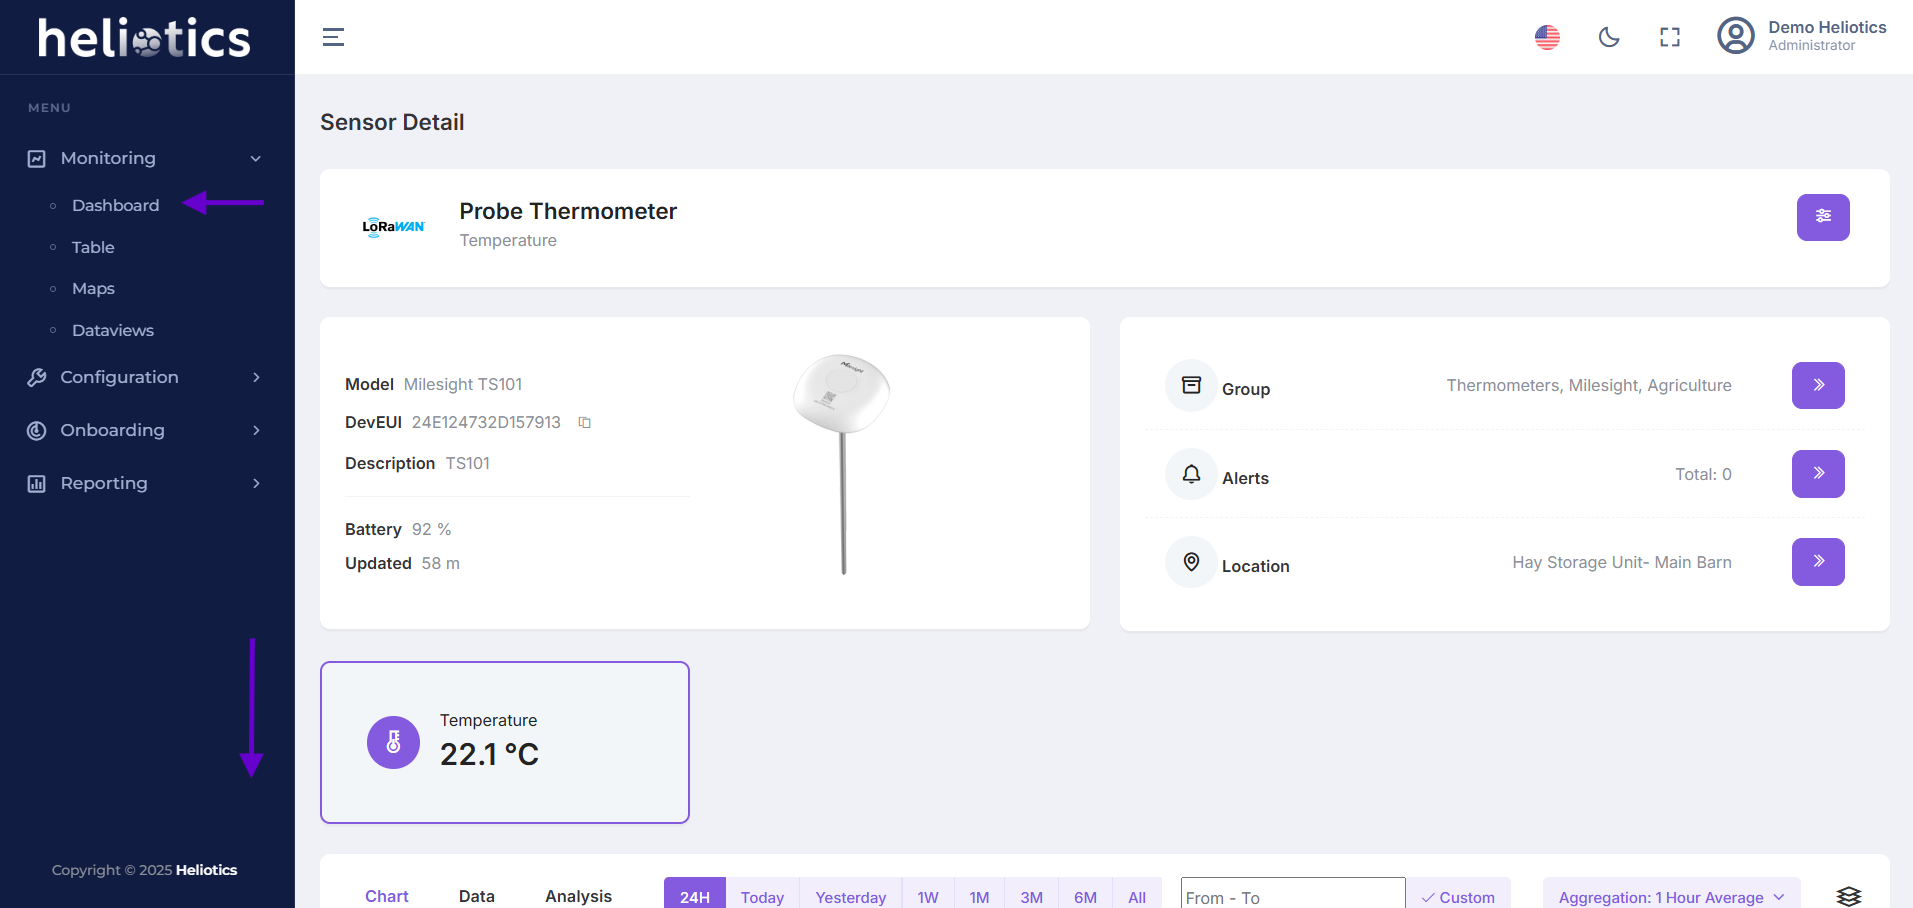
Open Sensor Details page and Scroll down to the Chart Section
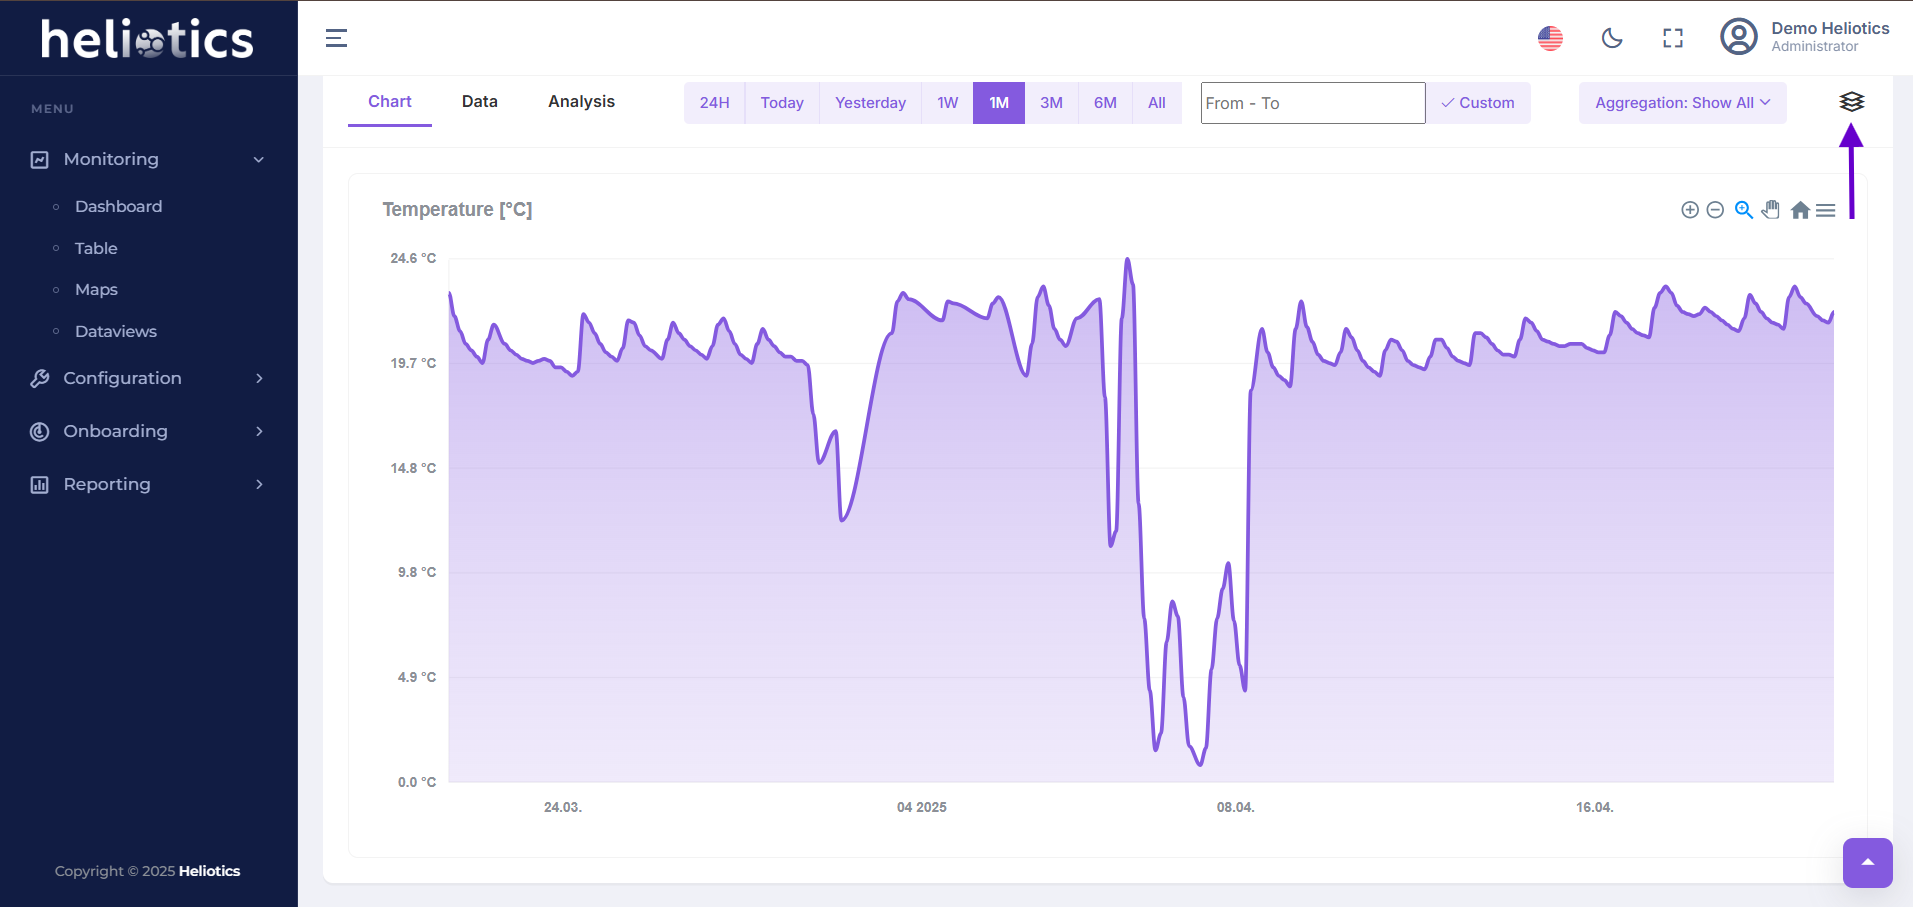
Click the Combine button next to the Chart title to open the Threshold settings
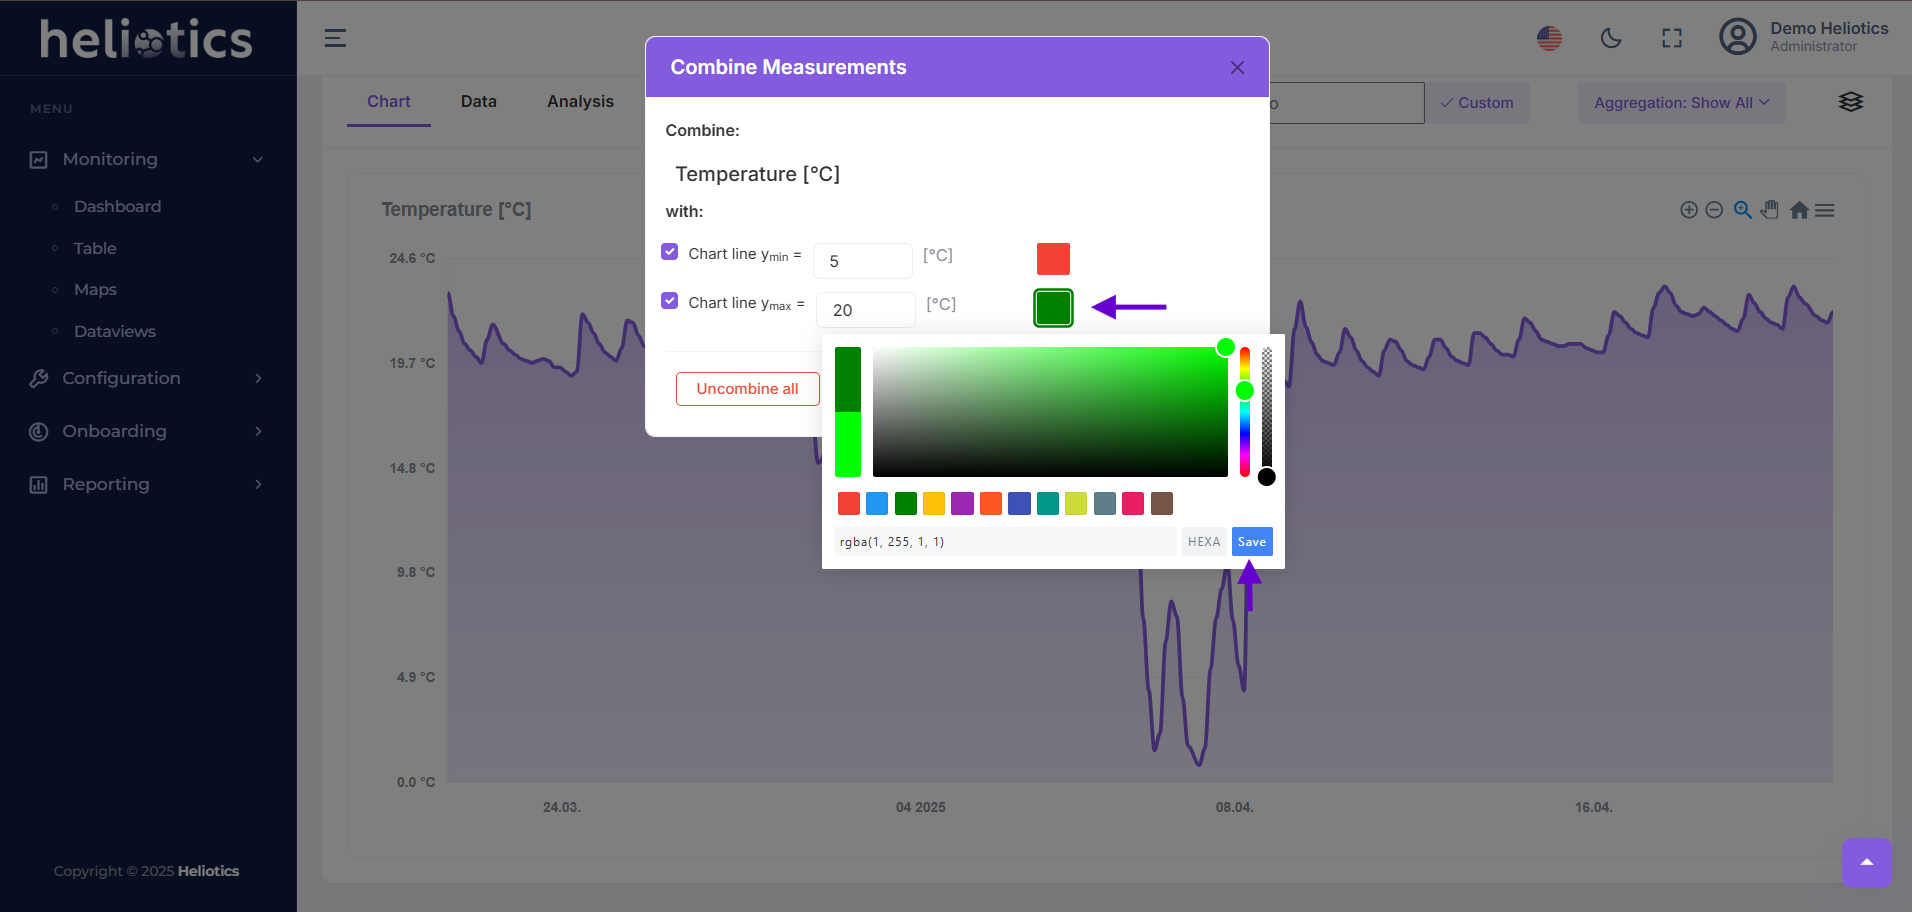
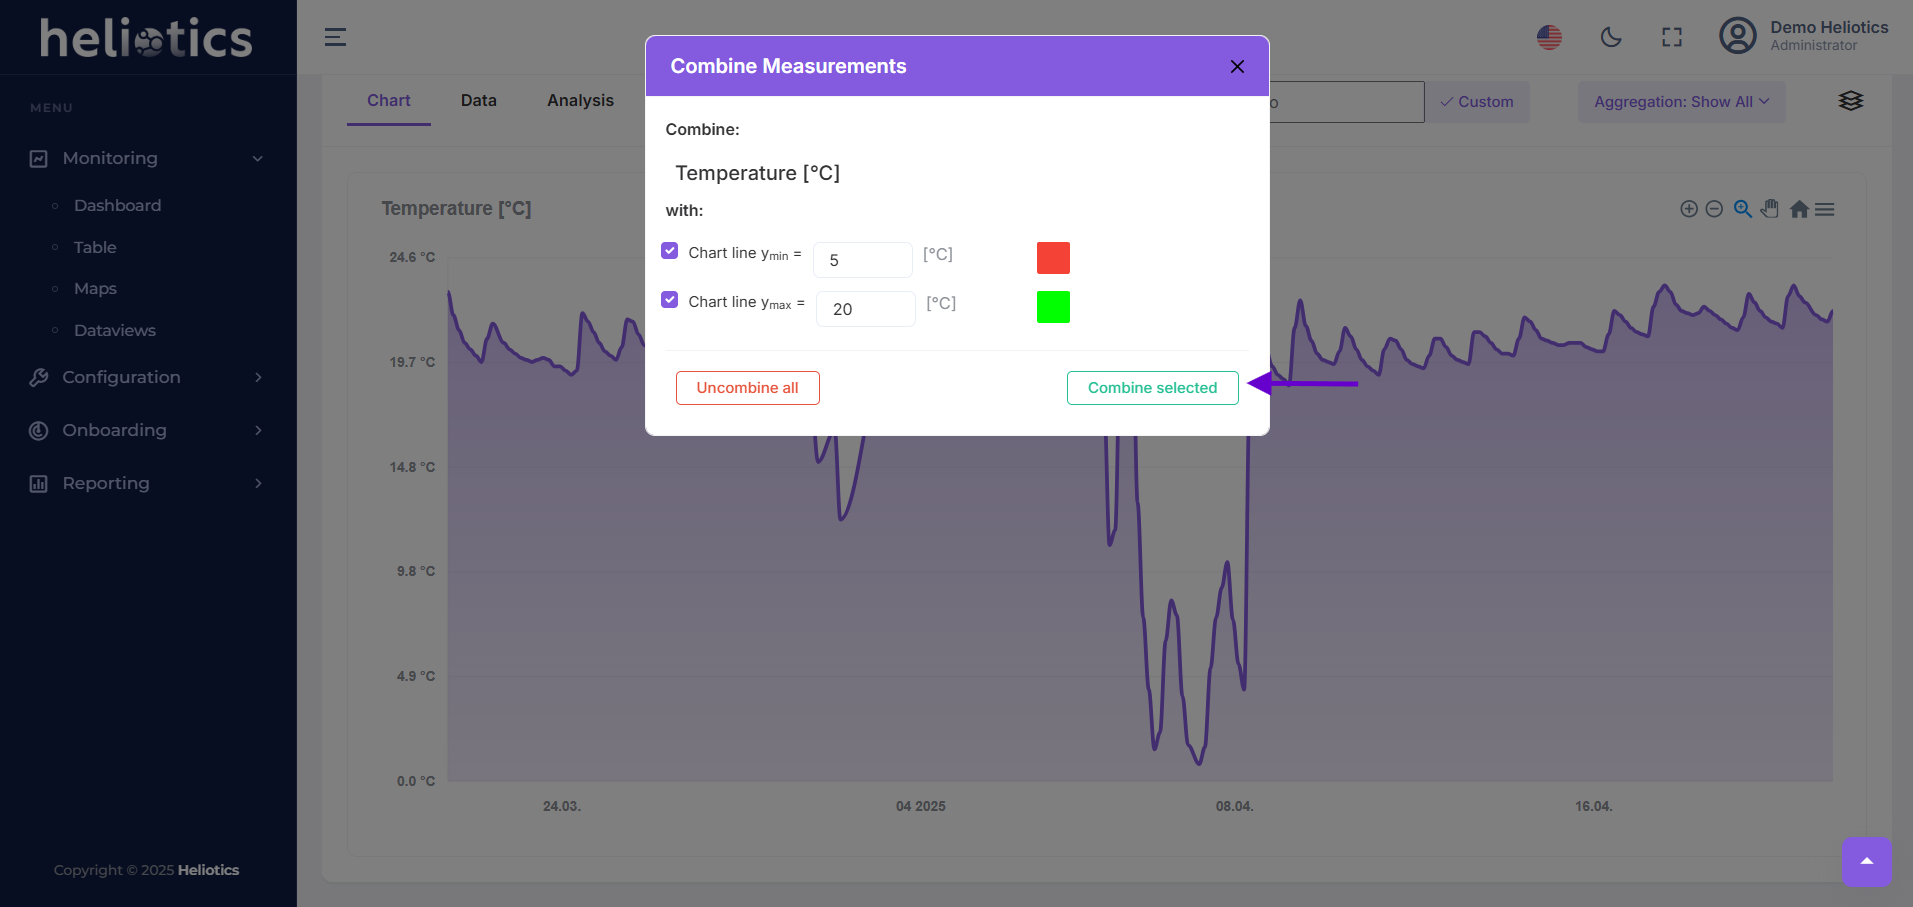
Enable the Minimum Threshold and enter your Lower bound value (e.g. 5°C)
Enable the Maximum Threshold and enter your Upper bound value (e.g. 20°C)
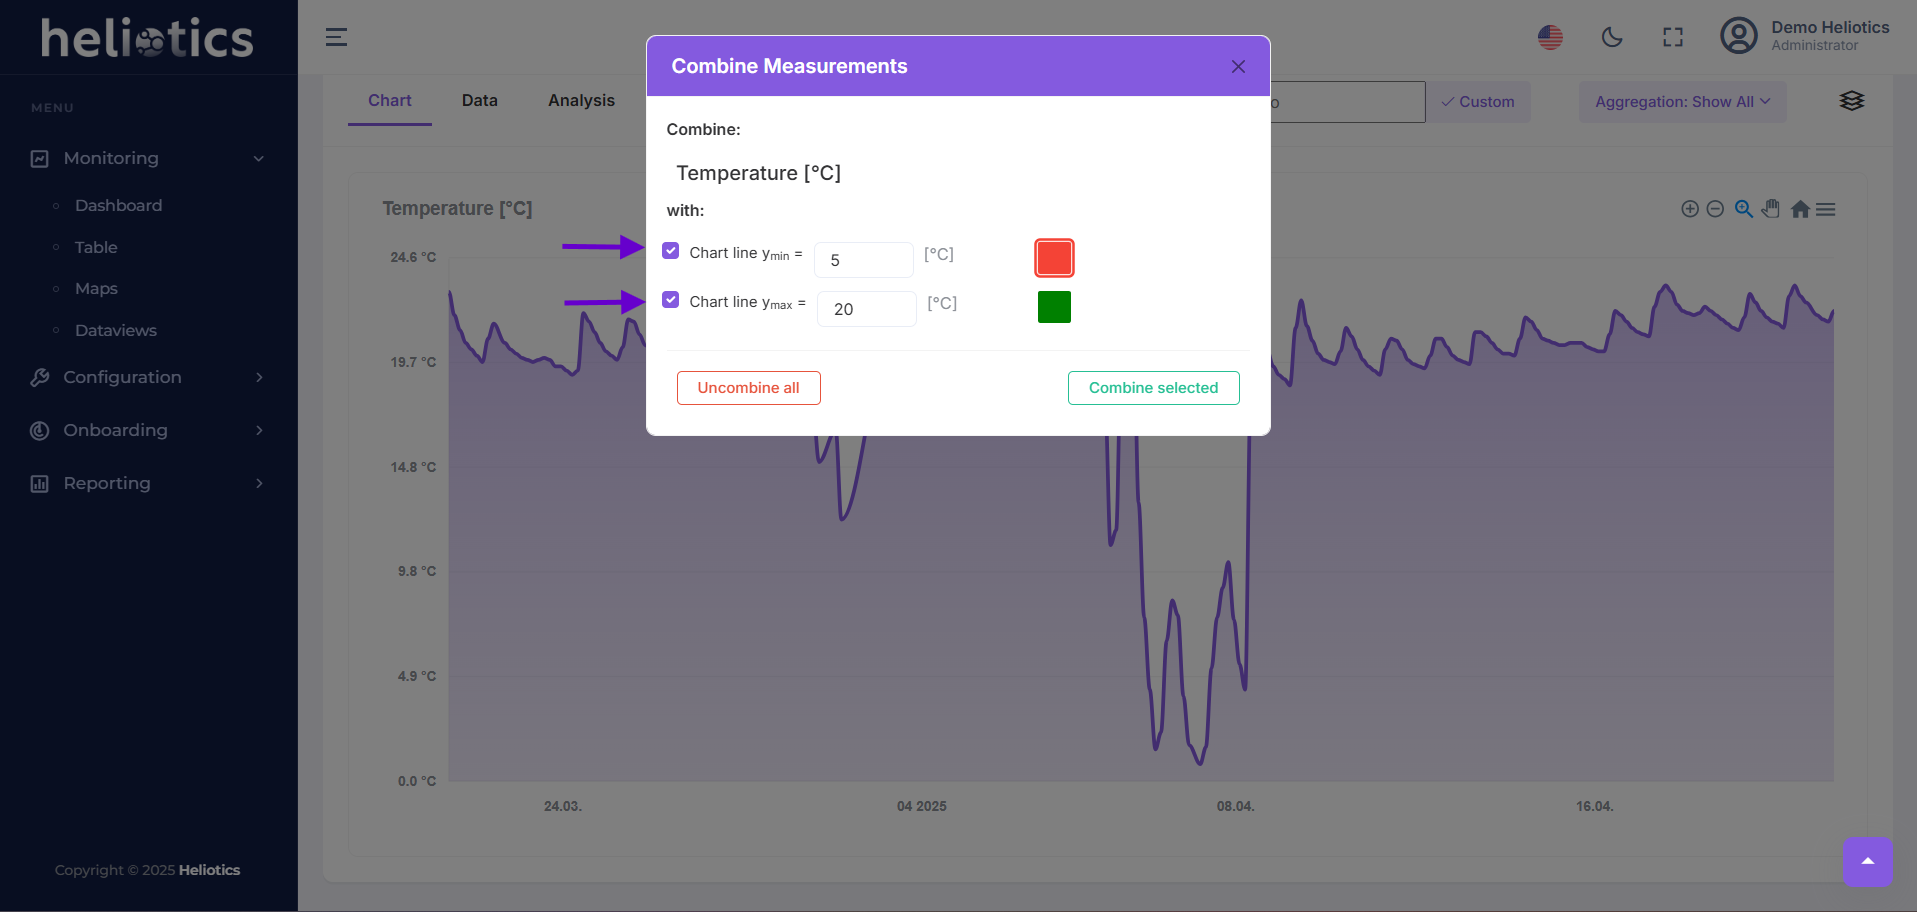
Click the Color swatch to choose a custom min/max line color
Click Combine selected to save and display both threshold lines on the Chart
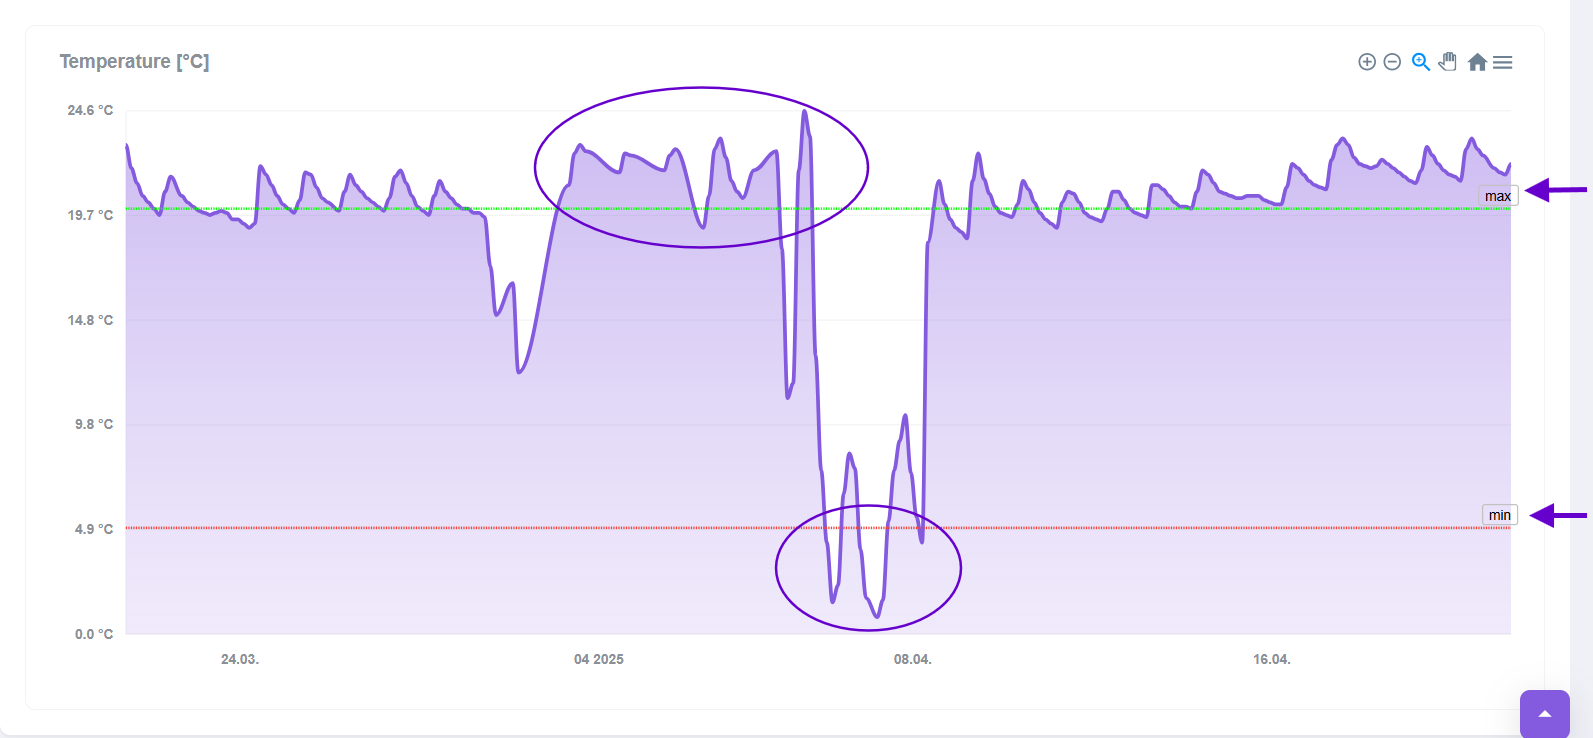
Visual indicators for your defined limits will now clearly display directly on your Chart, making it easier than ever to monitor critical thresholds and streamline your data analysis